
The global offshore wind sector has surged to unprecedented heights, with investments reaching a record-breaking $76.7 billion in 2023—a remarkable 79% increase over the previous year. This unprecedented capital flow has effectively counterbalanced a 17% decline in onshore wind investments, demonstrating the industry’s shifting priorities toward maritime energy generation. China continues to dominate market expansion, with the United Kingdom and United States following as significant contributors to the rapidly evolving landscape.
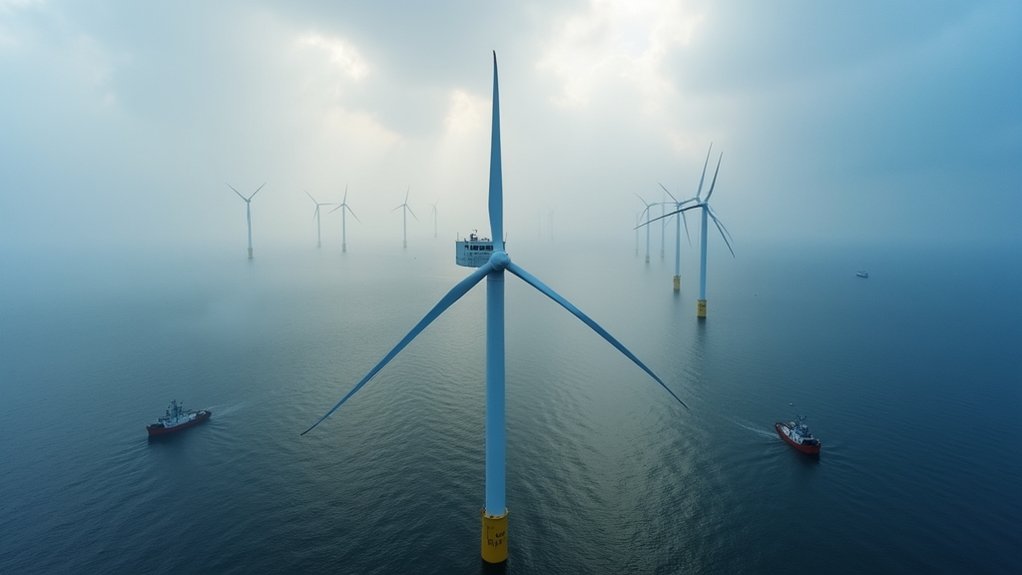
Operating offshore wind capacity now exceeds 68 gigawatts worldwide, supported by more than 13,000 turbines across 319 projects. The U.S. offshore wind pipeline grew an impressive 53% in 2023, reaching a total capacity of 80.5 GW. The technology density metrics have improved considerably, with projects now averaging 4.42 MW per square kilometer—though this varies substantially from 2.1 to 9.07 MW/km² depending on site-specific conditions and turbine deployment strategies.
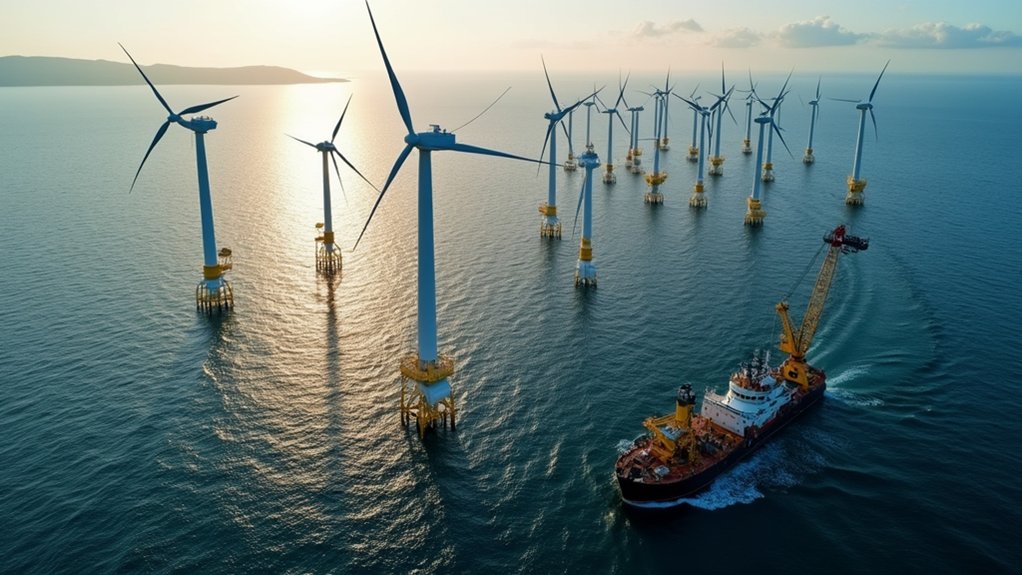
The offshore revolution continues unabated, with 68 GW of power harnessed from 13,000 turbines achieving ever-higher density across global waters.
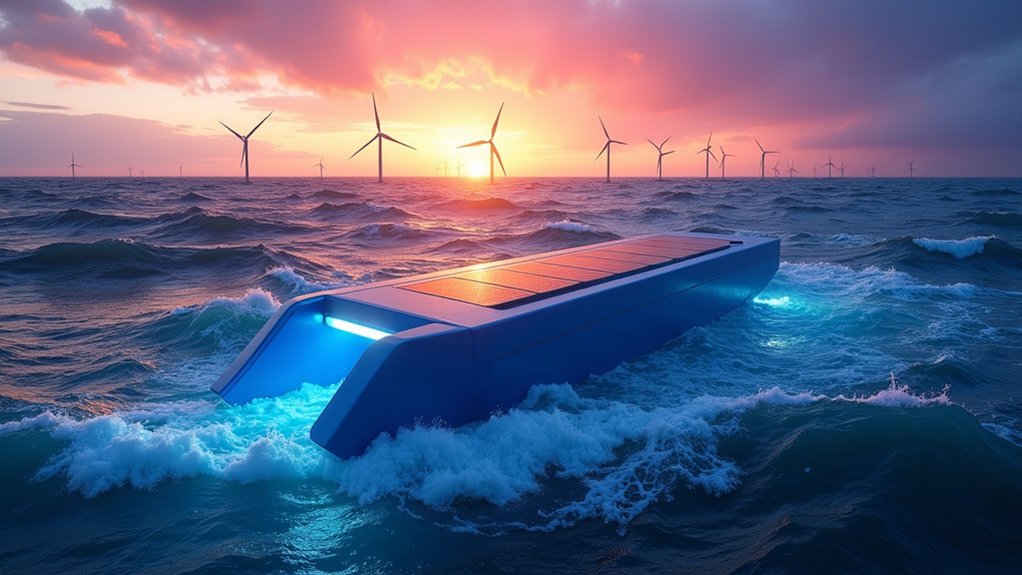
Floating offshore wind structures represent a particularly promising frontier, with capacity nearly doubling year-over-year to reach 0.23 GW. I’ve observed that these platforms reveal previously inaccessible deep-water locations, effectively expanding the geographical footprint of potential development zones. The flexibility of floating technology may prove critical to sustaining growth trajectories as near-shore sites become saturated. The total global installed capacity from all operating offshore projects reached 59,009 MW by the end of 2022, representing significant progress in renewable energy adoption worldwide.
Despite impressive investment figures, the sector faces substantial challenges. Project economics have deteriorated amid equipment cost inflation and supply chain disruptions. This turbulence manifested dramatically when 6.9 GW of contracted capacity across British and American markets withdrew from revenue agreements, citing unfavorable economics.
Permitting bottlenecks and grid connection hurdles further complicate timelines. The U.S. project pipeline remains robust at approximately 52,687 MW, encompassing everything from operational assets to newly leased areas awaiting development. Thirty-two distinct lease areas are currently progressing through various stages of development.
Major firms including Orsted and Iberdrola have reached final investment decisions despite challenging market conditions, signaling continued confidence in long-term sector fundamentals. Looking ahead, industry analysts anticipate increased government intervention through enhanced support mechanisms and risk-sharing frameworks throughout 2024.
These policy adjustments may prove essential to maintaining momentum in this capital-intensive but environmentally critical energy subsector.